TU Wien:Statistik und Wahrscheinlichkeitstheorie UE (Levajkovic)/Übungen 2023W/HW06.1
Zur Navigation springen
Zur Suche springen
- Histogram
Set
k <- 100and generatex <- rnorm(sample(k:(2*k),1), runif(1,0,k), rexp(1,1/k)).
- (a) Explain what is realized in
x.- (b) Plot a histogram of
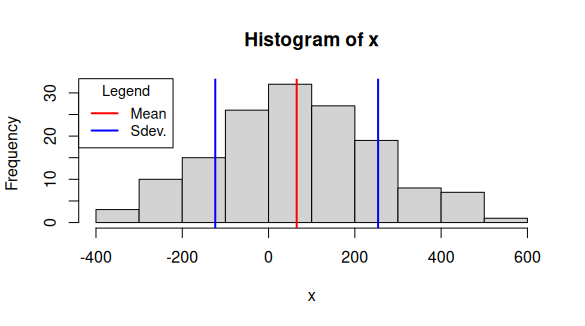
x. Mark its mean in red, its standard deviation in blue and add a legend which explains them both. Helpful commands:hist(),mean(),sd(),lines(),abline(),arrows(),legend()
Dieses Beispiel ist als solved markiert. Ist dies falsch oder ungenau? Aktualisiere den Lösungsstatus (Details: Vorlage:Beispiel)
Lösungsvorschlag von Friday[Bearbeiten | Quelltext bearbeiten]
--Friday Sa 30 Jan 2021 17:11:43 CET
# Statistics and Probability HW #6
# Friday
# Duedate: 16.11.2020
set.seed(1)

# Problem 3 - Histogram
# Set
k <- 100
#and generate
x <- rnorm(sample(k:(2*k),1), runif(1,0,k), rexp(1,1/k))

# Problem 3a)
# Explain what is realized in x.

# Solution:
# First we can add the arguments name to rnorm to make it more clear what
# happens:
# rnorm(n = sample(k:(2*k),1), mean = runif(1,0,k), sd = rexp(1,1/k))
sample(k:(2*k),1)
runif(1,0,k)
rexp(1,1/k)
# So we genearate 179 normaly distributed random samples. Whereas the
# normaldistribution has a median of 17.6 and a standard deviation of 8.4

# Problem 3b)
# Plot a histogram of x. Mark its mean in red, its standard deviation in blue
# and add a legend which explains them both. Helpful commands: hist(), mean(),
# sd(), lines(), abline(), arrows(), legend().
md <- mean(x)
sd <- sd(x)
hist(x, main="Normal Distribution")
abline(v=c(md -sd, md, md+sd), col=c("blue", "red", "blue"))
legend("topleft", legend=c("Mean", "Standard Deviation"),
       col=c("red", "blue"), lty=1)
Lösungsvorschlag von Simplex[Bearbeiten | Quelltext bearbeiten]
(a)[Bearbeiten | Quelltext bearbeiten]
sample(k:2*k),1): Randomly (uniformal distribution) selects one number from the interval k:(2*k)runif(1,0,k): Randomly (uniformal distrib.) selects one number from the interval .rexp(1,1/k): Randomly (exponential distrib.) selects one number (one oberservatio) with the rate .
(b)[Bearbeiten | Quelltext bearbeiten]
k <- 100
# rnorm(n, mean, sd)
x <- rnorm(sample(k:(2*k),1), runif(1,0,k), rexp(1,1/k))
# b)
hist(x)
mean_x <- mean(x)
sd_x <- sd(x)
abline(v=mean_x, col='red', lwd=2)
abline(v=c(mean_x + sd_x, mean_x - sd_x), col="blue", lwd=2)
legend("topleft", legend=c("Mean", "Sdev."), title="Legend", col=c("red", "blue"), lty=1, lwd=2, cex=0.9)
Plot ist weiter oben zu sehen.
--Simplex 18:32, 3. Feb. 2023 (CET)

