TU Wien:Statistik und Wahrscheinlichkeitstheorie UE (Levajkovic)/Übungen 2023W/HW06.2
Zur Navigation springen
Zur Suche springen
- Boxplot
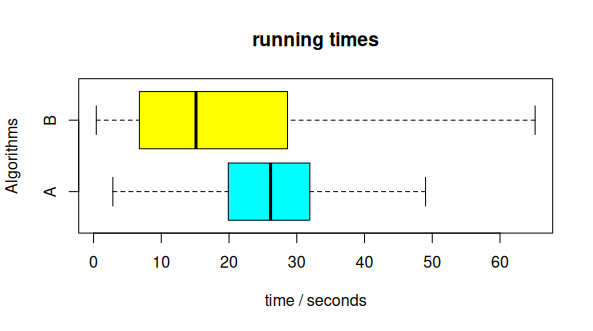
Two novel randomized algorithms (A and B) are to be compared regarding their running time. Both algorithms were executed n times. The running times (in seconds) are stored in the file
algorithms.Rdata.
- (a) Set the working directory and load the data using
load(). Create a boxplot to compare the running times. Color the boxes and add proper notations (axes notations, title etc.). More info via?boxplot.- (b) Comment on the following statements/questions only using the graphic
- The first quartile of the times in A was about?
- The interquartile range of the times in B is about trice the interquartile range of A.
- Is ?
- More than half of the running times in B were faster than 3/4 of the running times in A.
- At least 50\% in A were faster than the 25\% slowest in B.
- At least 60\% in A were faster than the 25\% slowest in B.
Dieses Beispiel ist als solved markiert. Ist dies falsch oder ungenau? Aktualisiere den Lösungsstatus (Details: Vorlage:Beispiel)
Lösungsvorschlag von Simplex[Bearbeiten | Quelltext bearbeiten]
(a)[Bearbeiten | Quelltext bearbeiten]
(b)[Bearbeiten | Quelltext bearbeiten]
- First quartile of A is 20.
- False, interquartile range of B is about twice of A.
- Cannot be read from the boxplot.
- True
- The median of B is and of A is 20.
- True
- Cannot be read from the boxplot. It is possible that either almost all values are just right from the median or at the border. Therefore this can't be answered.
--Simplex 18:07, 3. Feb. 2023 (CET)
