TU Wien:Statistik und Wahrscheinlichkeitstheorie UE (Bura)/Übungen 2019W/9.5
Zur Navigation springen
Zur Suche springen
- ANOVA by table
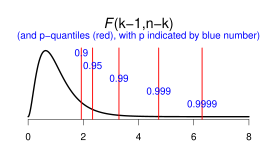
There where k groups compared with an ANOVA. Given the following incomplete output, and a plot of the associated -distribution, answer the questions below.
Analysis of Variance Table
Response: x
          Df Sum Sq Mean Sq F value Pr(>F)
gr         6    72      ?     ?        ?
Residuals  ?   240      6
- (a) What are the degrees of freedom?
- (b) What are the numerator and and denominator of the f-statistic?
- (c) What is the value of the f-statistic?
- (d) Using the plot, on which significance level can we reject the null hypothesis?
- (e) Using the plot, in which interval do we find the P-value?
- (f) How many groups are compared?
- (g) How many post-hoc pairwise t-tests are to be performed if all pairs were considered?
Dieses Beispiel hat noch keinen Lösungsvorschlag. Um einen zu erstellen, kopiere folgende Zeilen, bearbeite die Seite und aktualisiere den status=unsolved Mögliche status=... Werte stehen hier: Vorlage:Beispiel
== Lösungsvorschlag von ~~~ ==
--~~~~
Siehe auch Hilfe:Formeln und Hilfe:Beispielseiten.

